Pages

Thursday, June 5, 2014

BQ #7: Deriving the Difference Quotient

The difference quotient, f(x+h)-f(x)/h, is the slope of a secant line, which seems more complicated than the regular slope of y2-y1/ x2-x1, or rise over run. But it's not all that complicated. The complex difference quotient actually comes from the simple slope equation.
Now to find the slope of a line, we need to know 2 points on the graph, represented by (x,y). Now we replace that first y with f(x) to give us (x, f(x)) and replace the second x and y with (x+h), f(x+h). Now if we were to use the slope formula we would get:
f(x+h)-f(x)/(x+h)-x. And like any other algebraic problem, we simplify, canceling the x's on the bottom, giving us the difference quotient. 

Now you know where the difference quotient comes from. However, in calculus, we proceed further, to find what is known as derivatives. When finding the derivative, all possible tangent lines of a graph, you would find the limit as h approaches 0. But why 0? A tangent line touches a graph only once, while the secant line  touches the graph TWICE. So, in order for us to get one point, we can basically have those two points on top of each other... meaning that they are in the same place. We are able to get them to sit on top of each other by decreasing the "h", the distance between the two points. The smaller "h" is the closer the two points are. Therefore, we have our limit as h approaches 0 because we can't actually have it at 0, but we can get it pretty darn close.  

For a visual, go watch this video:
                            https://www.youtube.com/watch?v=XA0fZh8cXV8

Tuesday, May 20, 2014

BQ #6: Unit U

1. What is continuity? What is discontinuity?

Continuity is when the graph is predictable, has no breaks, jumps, or holes, could be drawn without lifting the pencil, and has the same value as the limit.


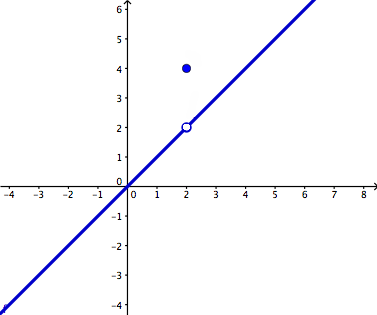
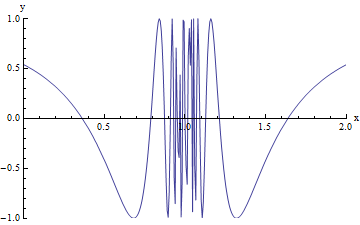
Discontinuity is the opposite: it is unpredictable, does have breaks, jumps, and holes, cannot be drawn without lifting the pencil, and varies if the value and the limit are the same. There are two families of discontinuities: removable and non-removable. A point discontinuity is the removable discontinuity, which is also known has the hole. There are three types of non-removable discontinuities: jump, which shows a "jump" or space between the function, infinite, which is also known as unbounded behavior and occurs where there is a vertical asymptote, and oscillating behavior, which shows the function as a condensed set of "wiggles".

 
Point discontinuity
http://dj1hlxw0wr920.cloudfront.net/userfiles/wyzfiles/4a69dec7-03e0-492f-ac16-4dcd555579c9.gif
 
Jump Discontinuity
http://image.tutorvista.com/content/feed/u364/discontin.GIF
 
Infinite Discontinuity
http://image.tutorvista.com/cms/images/67/inv-function-eg.JPG

Oscillating behavior
http://www.cwladis.com/math301/lecture%20images/infiniteoscillationdiscontinuityat1.gif

 
2. What is a limit? When does a limit exist? When does a limit not exist? What is the difference between a limit and a value?

A limit is the intended height of a function and is read as "the limit as x approaches 'a number' of f(x) is equal to 'L' ". A limit exists as long as you reach the same height from both the left and the right direction. If the graph does not break at a given x-value, then the limit will exist there. This means that a limit will exists in functions with holes. However, a limit will not be reached in non-removable discontinuities such as jumps, infinite discontinuities, or oscillating behavior. For jumps, the limit does not exist because the function has different left/right heights. For infinite discontinuities, the limit does not exist because of unbounded because due to vertical asymptotes.  However, we can still write one-sided limits. While limit is the intended height, the value is the actual height. This means that the limit and value can be the same or different depending on the function. Sometimes, there may be no actual value, as in the case with 2 open circles.

  http://00.educdn.com/files/static/mcgrawhillprof/9780071624756/LIMITS_AND_CONTINUITY_RAPID_REVIEW_02.GIF

As you can see here, the open circle (which is the limit) is different from the closed circle (which is the value).


3. How do we evaluate limits numerically, graphically, and algebraically?

To evaluate limits numerically, you will have to begin by drawing a table with 3 left and 3 right of number x is approaching. The values on the ends should be a tenth away from the center, and the closer you get to the center, the closer you get to the x-value. You would then plug the function into your graphing calculator and could either trace the location of the x-value or solve the function. An example can be seen below.


http://people.hofstra.edu/stefan_waner/realworld/tutorials/frames2_6a.html

To evaluate limits graphically, "plug the function into the y= screen on your graphing calculator. Then you can either go to 'tblset', make your independent variable 'ask', go to table, and then type in the values close to the limit. Or you could go to 'graph, hit 'trace', and trace to the value you are looking for" (Kirch). To find the limit, put your finger on a spot to the left and to the right of where you want to evaluate the limit and then move them together to find where they meet. If they don't, then there is no limit.
                          https://www.youtube.com/watch?v=_IT4hSM9DjA

When solving for limits algebraically, you need to begin with the direct substitution method. Like the name, all you need to do is take the number the limit is approaching and plug it in anywhere you see x. Through substitution, we can get 4 types of answers:
1. numerical answer
2. 0/#, which is 0
3. #/0 which is undefined and the limit does not exist
4. 0/0 indeterminate form


                          https://www.youtube.com/watch?v=1AKrjrl6Xpw


Now, if we end up with an indeterminate form, we must use another method to solve for the limit. The first one we could try out is the dividing out/ factoring method. You factor both the numerator and denominator and cancel out the common terms to remove the 0 in the denominator. Then once again, you use substitution with the simplified expression.

                        https://www.youtube.com/watch?v=zpcBkRpqHqQ

Now if you are unable to factor out, you will have to use the rationalizing/conjugate method. First you multiply the top and bottom by the conjugate (whichever term has the RADICAL). Then you simplify by foiling the value that was used to find the conjugate but leaving the other FACTORED. Then cancel out common terms, and substitute the simplified function to find the limit.

                          https://www.youtube.com/watch?v=WVj284EvgBI


Monday, April 21, 2014

BQ #3: Unit T Concepts 1-3

How do the graphs of sine and cosine relate to each of the others?Emphasize asymptotes in your response.

1. Tangent
With tangent, we know that the unit circle ratio would be sine over cosine. If we would put that into variables, y over x. When we look at how sine and cosine graphs relate to tangent, we notice that if both sine and cosine are positive, then tangent would be positive; if one is negative, then tangent is negative; if both are negative, then tangent is positive. That is basic division rules. Unlike sine and cosine, tangent graphs have asymptotes (which are areas that we cannot touch; undefined). What we need to realize is that the sine over cosine ratio is responsible for those asymptotes: if we divide any number by 0, it would come out as undefined. If cosine (x) were to be equal to 0, that would result in an asymptote. If we were to look at a unit circle, we should know that the x value would equal 0 at 90 degrees and 270 degrees. Converting back to the tangent graph and radians, we know that our asymptotes would be at pi/2 and 3pi/2.

                    https://www.desmos.com/calculator/hjts26gwst

2. Cotangent
With cotangent, we face the reciprocal unit circle ratio of cosine over sine, or x over y. When we look at how cosine and sine graphs relate to tangent, we notice that if both cosine and sine are positive, then cotangent would be positive; if one is negative, then cotangent is negative; if both are negative, then cotangent is positive. Unlike cosine and sine, cotangent graphs also have asymptotes Cotangent graphs are identically related to cosine and sine as its reciprocal, but have different asymptotes. If sine (y) were to be equal to 0, that would result in an asymptote. If we were to look at a unit circle, we should know that the y value would equal 0 at 0 degrees and 180 degrees. Converting back to the cotangent graph and radians, we know that our asymptotes would be at 0 and pi.


3. Secant
Unlike tangent and cotangent, secant is only related to the cosine graph. The unit circle ratio of secant is 1/cosine. If cosine were to have positive values on its graph, so would secant, and vice versa. Because secant is the reciprocal of cosine, we notice that if we were to have a low value on the cosine graph, the reciprocal of that value would be bigger on the secant graph, and vice versa. We should also notice that each curve of the secant graphs touch the "mountains" and "valleys" of the cosine graph. Looking at a graph, if we were to have a value of 0 on the cosine graph (0/1), we should know that that is where our asymptotes would be for the secant graph(1/0 = undefined).
                 https://www.desmos.com/calculator/hjts26gwst

4. Cosecant
Again, unlike tangent and cotangent, cosecant is only related to the sine graph. The unit circle ratio of cosecant is 1/sine. If sine were to have positive values on its graph, so would cosecant, and vice versa. Because cosecant is the reciprocal of sine, we notice that if we were to have a low value on the sine graph, the reciprocal of that value would be bigger on the cosecant graph, and vice versa. We should also notice that each curve of the cosecant graphs touch the "mountains" and "valleys" of the sine graph. Looking at a graph, if we were to have a value of 0 on the sine graph (0/1), we should know that that is where our asymptotes would be for the cosecant graph(1/0 = undefined).


Friday, April 18, 2014

BQ #4: Unit T Concept 3

Why is a “normal” tangent graph uphill, but a “normal” cotangent graph downhill? Use unit circle ratios to explain.

If we refer to the unit circle and ASTC, we know that tangent and cotangent are positive in quadrants 1 and 3 and negative in quadrants 2 and 4. If we were to break apart the unit circle into a line, we would get + - + - values for both trig functions. And unlike the other trig functions, tangent and cotangent have a period of pi rather than 2pi.

Tangent has the ratio of sin/cos (y/x), so we get asymptotes whenever cosine is equal to zero. On the unit circle, that would be the values of pi/2 and 3pi/2. If we were to draw out the graph, we notice that it goes "uphill" because each asymptote compresses an area where the graph would start with negative values and into positive values.


Cotangent has the ratio of cos/sin (x/y), so we get asymptotes whenever sine is equal to zero. On the unit circle, that would be the values of 0 and pi. If we were to draw out the graph, we would notice that it goes "downhill" because each asymptote compresses an area where the graph would start with positive values and into negative values.


Thursday, April 17, 2014

BQ #5: Unit T Concepts 1-3

Why do sine and cosine NOT have asymptotes, but the other four trig graphs do? Use unit circle ratios to explain.

Sine and cosine do not have asymptotes because their ratios: y/r and x/r. This means that the radius (r) will always be equal 1, and will never have a 0 as the denominator. Sine and cosine will not encounter asymptotes because we will never have an undefined answer (0 divided by any number).
Unlike sine and cosine, the other four trig graphs do include asymptotes. Cosecant has a ratio of r/y. The "y" value can be 0 in :(1,0) or (-1,0). Secant has a ratio of r/x and x can be 0 in : (0,1) and (0, -1). Cotangent and tangent have the ratios of x/y and y/x, which means either numerator can have the value of 0.

A crucial thing to remember is that cotangent and and cosecant have the same denominator in their ratios (y), which means they will have the same asymptotes. Tangent and secant will have the same asymptotes because their denominators in their ratios (x).

Wednesday, April 16, 2014

BQ #2: Unit T Concept Intro


How do the trig graphs relate to the Unit Circle?

Period? - Why is the period for sine and cosine 2pi, whereas the period for tangent and cotangent is pi?

When we refer back to the Unit Circle involving sine, cosine, and tangent, we remember ASTC to remember which trig function is positive for each quadrant.


If we refer to ASTC for sine, we know that the function would be positive in quadrants 1 and 2, and negative in quadrants 3 and 4. This creates the repetition of + + - -. When dealing with periods, we have to have a completed pattern. And since it takes the whole unit circle, which equals 2pi, to make that pattern repeat itself, the period is 2pi.


                                  http://www.regentsprep.org/Regents/math/algtrig/ATT5/sine77.gif


This idea also goes for cosine. The function is positive in quadrants 1 and 4, and negative in quadrants 2 and 3. This gives us the repetition of + - - +. Because it does not have a repeating pattern, a cosine period is also 2pi.
 
 
Unlike sine and cosine, a tangent period is only pi. Referring to ASTC, tangent is positive in quadrants 1 and 3 and negative in quadrants 2 and 4, which gives us the pattern of + - + -. Comparing to sine and cosine, we already have a pattern, but instead of going all the way around the unit circle for a period, we only need to go half way, or pi.
                                        http://www.clarku.edu/~djoyce/trig/tan.gif

Amplitude? – How does the fact that sine and cosine have amplitudes of one (and the other trig function)relate to what we know about the unit circle?
Amplitudes are half the distance between the highest and the lowest points on the sine and cosine graphs. Sine has the ratio of y/r and cosine has the ratio of x/r. R can only equal 1 (the radius of a unit circle is 1), which means the values x and y can only go up to 1. When dealing with the value of sine and cosine, we should know that sine and cosine have a value range of -1 to 1; anything out of that range would leave the trig function undefined. Now we look at other trig functions: tangent is y/x. We are not restricted to value range of -1 and 1 because we can divide by any other number. Cotangent is the reciprocal (x/y) of tangent. For cosecant and secant, they have the ratios of r/y and r/x. You can divide your "r", which is 1, by a smaller number, and get any value bigger than -1 or 1. That is why those other functions do not have amplitudes, but instead asymptotes.


Friday, April 4, 2014

Reflection #1: Unit Q: Verifying Identities

1.What does it actually mean to verify a trig identity?

To verify a trig function means to have a different version of the same trig function. We could have different trig functions in equations or fractions, but eventually reduces to one trig function.

2.What tips and tricks have you found helpful?

To get through this unit, it is crucial to memorize all the trig identities. It was easy to do because we had already learned and memorized all the reciprocal identities from a past unit. Also remember that reciprocal and ratio identities are able to power up or down, but not Pythagorean identities.

3.Explain your thought process and steps you take in verifying a trig identity.  Do not use a specific example, but speak in general terms of what you would do no matter what they give you.

To get through to verify a trig function, the first thing I do is look for any identities to simplify the function. I would look for any greatest common factors, cancel out, combine like terms, or it dealing with fractions, I would multiply the fraction by the conjugate to get a common denominator. If there are any tan or cot functions, I could use ratio identities to convert them to sin and cos, but one thing I remember is not to square anything because I am only allowed to square both sides. 

Tuesday, March 18, 2014

WPP #13-14: Unit P Concept 6 & 7: Applications with Law of Sines and Cosines

“Please see my WPP13-14, made in collaboration with Nga Mai, by visiting their blog here.  Also be sure to check out the other awesome posts on their blog”

Wednesday, March 5, 2014

I/D #2: Unit O: How can we derive the patterns for our special right triangles?

Inquiry Activity Summary:
1. 30-60-90 triangle
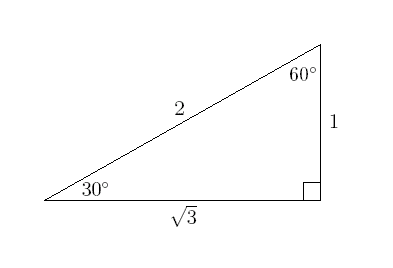
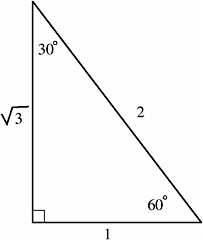
To derive the pattern for 30-60-90 triangles, we need to look at equilateral triangle, which has all equal side lengths and angle degrees. In this case, all sides are equal to 1. When we cut it down the middle, it splits the triangle into two 30-60-90 triangles.


Using the Pythagorean theorem to find our missing leg length, we plug in our values to get (1/2)^2+ b^2= (1)^2. The (1/2) came from the one side length that got cut into two. The (1) length would be our hypotenuse, which was already given to us. Now we solve for b to get √3/2


Now because we do not want any fractions to make things complicated, we multiply all the leg lengths by 2 to get "prettier" numbers.


Because we want to be able to apply this pattern for all 30-60-90 triangles with different side lengths, we need to use a variable to allow for the same ratios as the triangle with side lengths of 1.


2. 45-45-90 triangle
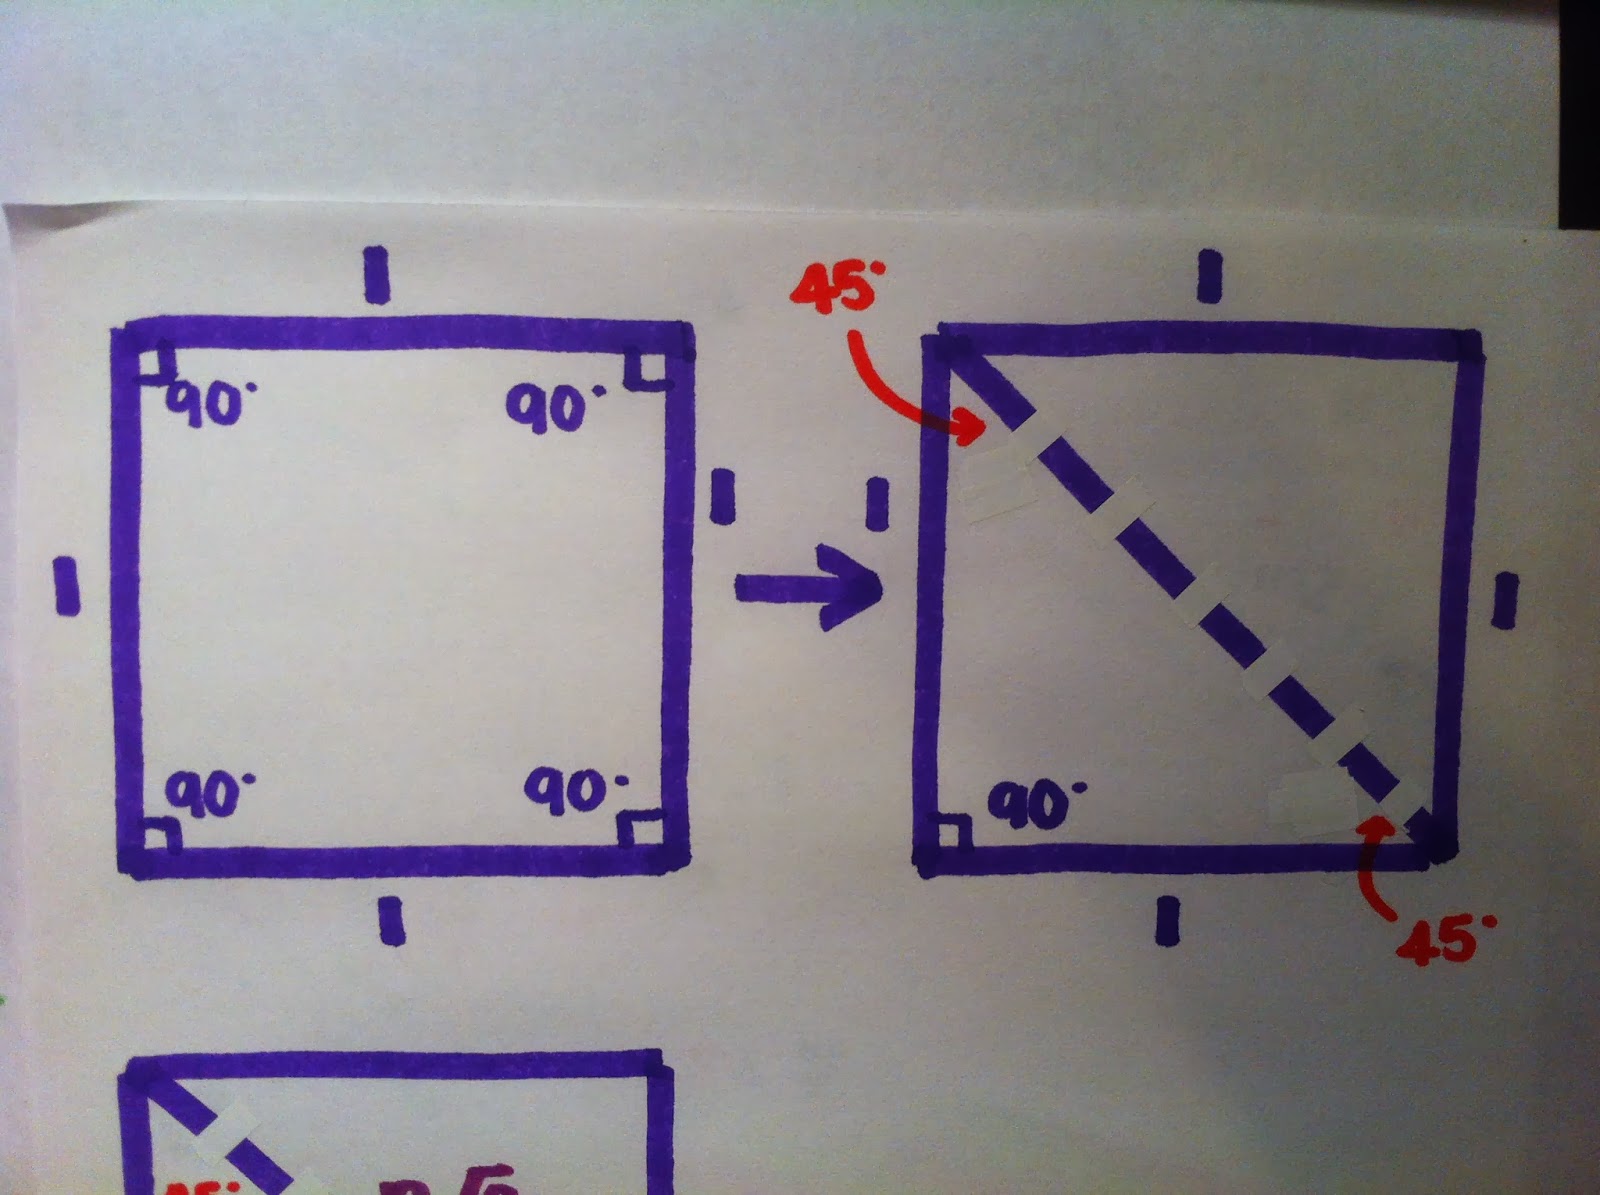
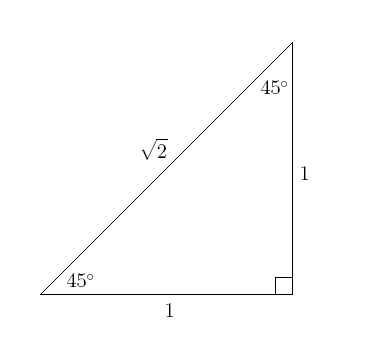
To derive the pattern for 45-45-90 triangles, we need to look at squares, which has all equal side lengths and angle degrees. In this case, all sides are equal to 1. When we cut it diagonally, it splits into two 45-45-90 triangles.


Using the Pythagorean theorem to find our missing leg length, we plug in our values to get (1)^2+ (1)^2= c^2. The (1) lengths would be our two legs, which was already given to us. Now we solve for c to get √2.


Because we want to be able to apply this pattern for all 45-45-90 triangles with different side lengths, we need to use a variable to allow for the same ratios as the triangle with side lengths of 1.


Inquiry Activity Reflection
 

1. Something I never noticed before about special right triangles is that the ratios came from the Pythagorean theorem.

2. Being able to derive these triangles myself aids in my learning because I now completely understand the rules of special right triangles. Through this activity, I understand where these values come from.

Saturday, February 22, 2014

I/D #1: Unit N Concept 7: How do SRTs and the UC relate?

Inquiry Activity Summary:The activity we completed in class was a throw back to geometry and the concept of special right triangles. We made the connection between these right triangles and the concept of the unit circle and how they are seen within them. With our radius of 1 (because a unit circle always has a radius of 1), we can figure out our lengths of each side of each triangle. Consequently, we can find the ordered pairs of the triangles that create the 30, 45, and 60 degrees.


1. 30 degree triangle
Here we have a 30 degree triangle. The angle opposite of the 30 degree angle has a length of 1,  the adjacent side has the length of √3, and the hypotenuse side has a length of 2. Labeling the triangle, the horizontal side is x, the vertical side is y (just like on a graph!), and the hypotenuse is r (for radius). Because we're dealing with special right triangles in a unit circle, we need the hypotenuse to equal 1. In this case, we need to divide all sides by 2, which would give us:
x=√3/2
y=1/2
r=1
When we plot the triangle in a graph in quadrant 1, we have the labeled angle of 30 degrees as the origin or (0,0), the right angle would be (√3/2,0), and the 60 degree angle would be (√3/2, 1/2).


2. 45 degree triangle
Here we have a 45 degree triangle. Notice that because 2 sides of the triangle has the same angle of 45 degrees, the opposite sides of each angle has the same length of 1. The hypotenuse of the 45 triangle is √2. Labeling the triangle, we need to divide all the sides by √2, which would give us:
x and y= √2/2
r=1
When we plot the triangle in a graph in quadrant 1, we have the labeled angle of 45 degrees as the origin or (0,0), the right angle would be (√2/2,0), and the 60 degree angle would be (√2/2,√2/2).


http://images.books24x7.com/bookimages/id_15618/fig441_03.jpg

3. 60 degree triangle
If you couldn't already tell, the 60 degree triangle is the same as the 30 degree triangle, just flipped around. The side opposite of the 60 degree angle has the length of √3 ,the adjacent side has the length of 1, and the hypotenuse has the length of 2 (just like the 30 degree angle). Labeling the triangle, again we need to divide all sides by 2, which would give us:
x=1/2
y=√3/2
r=1
When we plot the triangle in a graph in quadrant 1, we have the labeled angle of 60 degrees as the origin or (0,0), the right angle would be (1/2,0), and the 60 degree angle would be (1/2,√3/2).


4. The activity and the use of these triangles allows us to understand and connect the parts of the unit circle, such as the length values and ordered pairs.  All the points of the unit circle go with either the 30, 45, or 60 degree angles, which are seen throughout the other quadrants. We notice a pattern of reference angles, radians, and ordered pairs. Doing these triangles of quadrant 1 allow us to comprehend the other quadrants because they are all the same, just flipped. We can also explain the ordered parts of the quadrant angles, 0/ 360 degrees is (1,0), 90 degrees is (0,1), 180 degrees is (-1,0), and 270 degrees is (0,-1).

5.  The triangles in this activity lie in the first quadrant. When we draw these triangles in the other quadrants, the ordered pairs switch around with negatives due to their position. For quadrant 2, all of the x values would be negative (left of y axis). For quadrant 3, both x and y values would be negative (left of y axis and below x axis). For quadrant 4, y values would be negative (under x axis).

Quadrant 2: 30 degree triangle: all x values negative

Quadrant 3: 45 degree triangle: all x and y values negative

Quadrant 4: 60 degree triangle: all y values negative

INQUIRY ACTIVITY REFLECTION

1. The coolest thing I learned from this activity was how all the 4 quadrants follow the same patterns of special triangles, making it easier to plot down the unit circles parts.
2. This activity will help me in this unit because I understand where the values of the Unit Circle comes from, that the numbers are not random but patterned, and that you can find them using special right triangles.
3. Something I never realized before about special right triangles and the unit circle is how they are all interconnected. I never noticed that you could be able to draw these special right triangles with in the Unit Circle and have all the ordered pairs the same, just a fix of negatives.

Tuesday, February 11, 2014

RWA# 1: Unit M Concept 4-6 - Conic Sections in Real Life - Hyperbolas (Concept 6)

 
 1. "The set of all points such that the difference in the distance from two points is a constant." (Kirch)

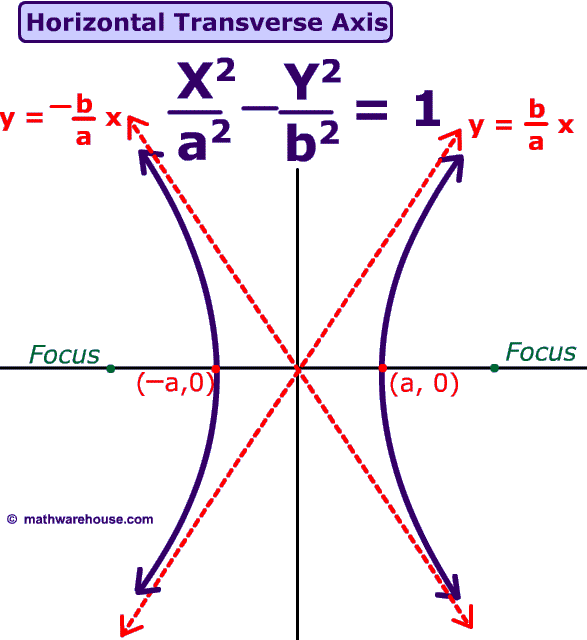
2. Algebraically and graphically,  a hyperbola was look like this:

 
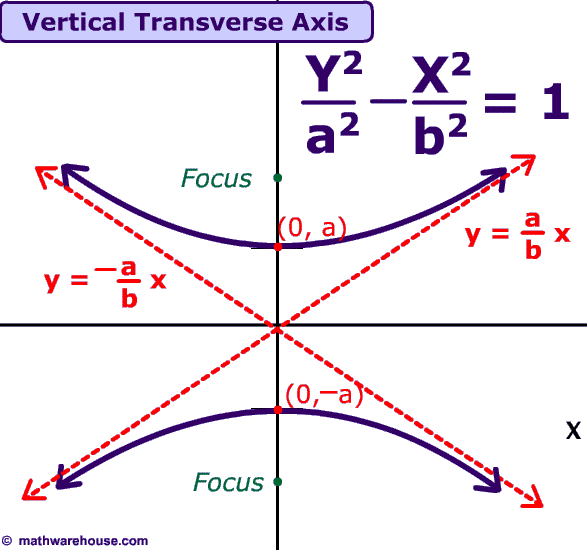
or like this:

      (http://www.mathwarehouse.com/hyperbola/images/picture-of-hyperbola-vertical-transverse.gif)
 
For graphing each hyperbola, the direction depends on whether the "y" or "x" is negative. If the "y" is negative, then the hyperbolas will have a left and right direction (picture 1). If the "x" is negative, then the hyperbolas will have an up and down direction (picture 2).

The key features of hyperbolas are: center, transverse axis, conjugate axis, vertices, co-vertices, foci, eccentricity, and asymptotes. To find the center, we need to remember : "h" goes with "x" and "k" goes with "y". Going into our standard form, we find our "h" and our "k", our center (h,k). You can plot the center, and go on from there.

Looking at standard form, whichever term ("x" or "y") comes first will determine whether your transverse axis is horizontal or vertical. If "y" is the negative term, that tells us that our transverse axis will be horizontal. If "x" is the negative term, that tells us that our transverse axis will be vertical. Knowing this, we will know that our conjugate axis must be the opposite. So if our transverse axis is vertical, our conjugate axis will be horizontal and vice versa. (Side note: By knowing if the axes are horizontal or vertical, we will know if our lines will be "x=" or "y=". And because we know our axes go through our center, we know those "x=h" and "y=k".) The distance of the transverse axis is 2a ("a" is the square root of the denominator beneath the first term) and the distance of the conjugate is 2b ("b" is the square root of the denominator beneath the second term). To determine your transverse and conjugate axes graphically, look at the branches. If your branches go left and right, your transverse axis is horizontal. If your branches go up and down, your transverse axis is vertical. If you want to know the length of either of the axes, simply count the units (to find "a" or "b", divide the entire length of the axis by 2).

Graphically, the vertices are the ends of the transverse axis; just look at the end points and you have the vertices. Algebraically, all you need to know is what your "a" is. If your transverse axis is "x=" then you know that the "x's" in your vertices will remain the same as your center. From there, all you need to do is add and subtract "a" to "k". The same would for the co-vertices. Look for the end points of the conjugate axis on your graph. Algebraically, find "b" and add that to the value that is changing ("x" or "y").

Your foci is the same idea, with the adding to either the "x" or "y" values of your center (because your foci are "c" units away from your center). The focus will always be on the transverse axis long side the vertices.
"Eccentricity is a measure of how much the conic section deviates from being circular" (Kirch). For a hyperbola, it must be greater than 1. Algebraically, to find the eccentricity, we use the formula "e=c/a."

Unlike the other conics, hyperbolas have asymptotes (restrictions). To find the asymptotes algebraically, we use between two formulas depending on the direction of the transverse axis. If it is horizontal, then we use y= k± b/a (x-h). If it is vertical, then it is y=k± a/b (x-h). On a graph, you will notice the two dotted lines making an X going through the center and corners of the box: that would be your asymptotes. Notice how the hyperbolas are drawn really close to them, but never touches!

   If you need an example to put all of this information together, here is a video to help you visually!

                                         (http://www.youtube.com/watch?v=Z6cwpsDC_5A)
3. Real world applications of hyperbolas can be seen in cooling towers for nuclear reactors.  When building cooling towers, there were problems in creating a building that would be able to "withstand high winds" and "intense conditions with as little material as possible". (http://www.pleacher.com/mp/mlessons/calculus/apphyper.html) Eventually, engineers discovered the benefits of creating these towers into the shape of a 3D hyperbola. 

By building these towers into hyperboloids, they are able to stand up to high winds and use less material. "A 500 foot tower can be made of a reinforced concrete shell only six to eight inches wide." (http://www.pleacher.com/mp/mlessons/calculus/apphyper.html) Also, they help the upward air flow move faster, cooling things faster and better.

 
Works Cited: